| NADP: Keeping You Connected |
May 2015 | Issue 3 |
|
NADP: Keeping You Connected is a quarterly e-newsletter designed to keep you informed about our changing chemical climate and other updates from the National Atmospheric Deposition Program. To offer feedback or submit a suggestion, please email nadp-news@isws.illinois.edu. If you were forwarded this notification and would like to receive future newsletters, click here to subscribe.
|
In this issue:
Nitrogen Deposition in the Mississippi River Basin
By Ray Knighton, Air Quality National Program Leader
National Institute for Food and Agriculture-USDA
|
|
|
Figure 1. Click to enlarge
|
The loading of nutrients like nitrogen to the Gulf of Mexico via the Mississippi River has created conditions for algae to thrive. These microscopic waterborne plants cloud water and block sunlight, which can interfere with aquatic plant and animal productivity. Decomposition of algae and other dead matter removes oxygen from bottom waters and can lead to hypoxia, a low-oxygen condition. A large hypoxic zone in the Gulf of Mexico has averaged about 5,300 square miles for the past 30 years. Fish, shrimp, and crabs evacuate the hypoxic area leading to loss of a very important commercial fishery. Understanding the contributions of various sources of nutrients to the Mississippi, such as atmospheric nitrogen deposition, is crucial for assisting scientists and policy makers in developing solutions to reduce the size of the hypoxic zone.
The new total nitrogen deposition maps, now available for the United States through the National Atmospheric Deposition Program (NADP), will assist with the effort to better understand the nitrogen contribution to the Mississippi River Basin (Figure 1). In 1977, the State Agricultural Experiment Stations organized what is now known as the NADP, a research committee to measure atmospheric deposition in rainfall and study its effects on the environment. In 2010, the Ammonia Monitoring Network (AMoN) was created through NADP to provide a consistent, long-term record of ammonia gas concentrations across the United States. Ammonia monitoring was a key ingredient to be able to estimate dry nitrogen deposition. Estimates of total nitrogen deposition are obtained by combining the wet deposition values with the dry deposition values and calculated by the total deposition hybrid model developed by the NADP Total Deposition (TDEP) Science Committee (Schwede and Lear, 2014).
The Hypoxia Task Force meets in Columbus, Ohio on May 20, 2015 to continue a dialogue between States in the Mississippi River Basin and the federal government on strategies to reduce the loading of nitrogen to the basin.
New Air Quality Online Tools for U.S. Forests and Parks
|
|
|
Figure 2. Click to enlarge
|
|
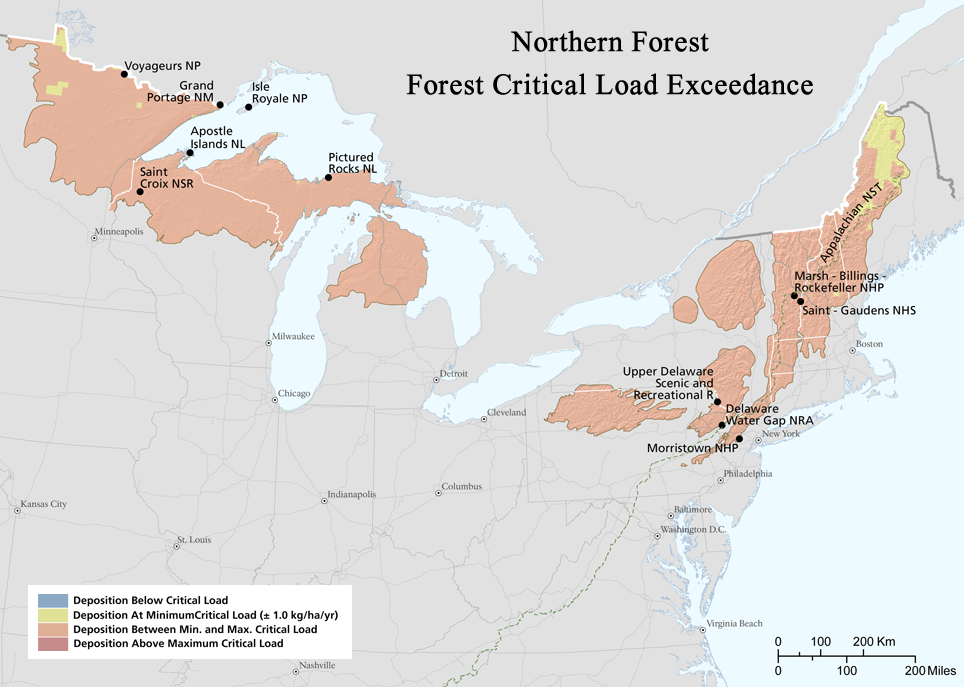
Air pollution emitted from a variety of sources is deposited from the atmosphere into the biosphere. These pollutants may cause ecological changes, such as long-term acidification of soils or surface waters, soil nutrient imbalances affecting plant growth, and loss of biodiversity. The term “critical load” describes the point at which a natural system begins to transform due to this deposition of air pollution. Comparing current deposition levels to critical loads can be used to draw inferences regarding ecosystem health, guide resource management decisions, and evaluate the effectiveness of emissions reduction strategies.
Two new online tools are available from the U.S. Forest Service (USFS) and the National Park Service (NPS) that rely on data and measurements from the NADP Critical Loads of Atmospheric Deposition (CLAD) and Total Deposition (TDEP) Science Committees to assist with the management of our nation’s forests and parks.
U.S. Forest Service Tool
National Forests and Grasslands are negatively impacted by the atmospheric deposition of sulfur and nitrogen. Acidification impacts include decreased soil nutrient availability, decreased growth/increased mortality of certain tree species, and decreased presence of fish species and macroinvertebrates. Nitrogen saturation impacts include eutrophication, algal blooms, and species community shifts/biodiversity loss. The USFS is using critical loads to assess the extent and severity of these potential impacts across our nation’s forests and grasslands, and to inform the land management planning and decision-making processes that serve to protect these lands.
The USFS developed the Air Quality Portal for Land Management Planning to serve as a decision support system for the implementation of critical loads into land management. Deposition estimates from the NADP TDEP Science Committee are compared with the NADP CLAD Science Committee’s critical loads of acidity for surface waters and forested ecosystems (Pardo et al., 2011). These empirical critical loads of nitrogen for lichens, mycorrhizal fungi, herbaceous plants and shrubs, forests, and nitrate leaching can determine where these critical loads are being exceeded, and therefore where anticipated associated ecosystem effects to national forests and grasslands are possible.
The USFS Air Quality Portal provides these critical load exceedance calculations and outlines a process to assess the extent and severity of these exceedances. Monitoring and management recommendations are also provided, outlining actions that can be taken in an area concerned with critical load exceedances. The website also includes background information on atmospheric deposition and critical loads of air pollution, national maps, a glossary, sample land management plan components and assessments, and training materials.
National Park Service Tool
Many park ecosystems are sensitive to nitrogen deposition. Excessive inputs of atmospheric nitrogen can stress ecosystems by reducing biodiversity, disrupting nutrient cycling, and leading to shifts in plant and animal species composition. Critical loads are a tool the NPS uses to assess and understand the impacts of nitrogen deposition to park ecosystems and to help inform policy decisions meant to protect these parks.
The NPS has developed a web-based tool to identify areas where critical loads may be exceeded and air pollution damage to ecosystems may be occurring. The tool uses critical load data for five indicators (forests, herbaceous plants, lichen, mycorrhizal fungi and nitrate leaching) in 12 ecoregions, obtained from USFS scientists. These critical loads are then compared to the 2010-12 three-year average estimated total-N deposition from the NADP total deposition hybrid model. The maps and tables produced allow users to identify NPS lands that may be experiencing N deposition which exceeds a critical load and where ecosystems may be at risk. Crucially, because the total deposition mapping spans the entire continental U.S., this comparison is possible for all NPS natural resources and not only those that have direct monitoring.
This information will assist parks in assessing the risk to ecosystems from nitrogen deposition and can be used in park planning, NEPA analyses, and interagency work to influence emissions reductions.
National Trends Network 400,000th Sample Recorded
|
|
|
Figure 3. Click to enlarge
|
|
|
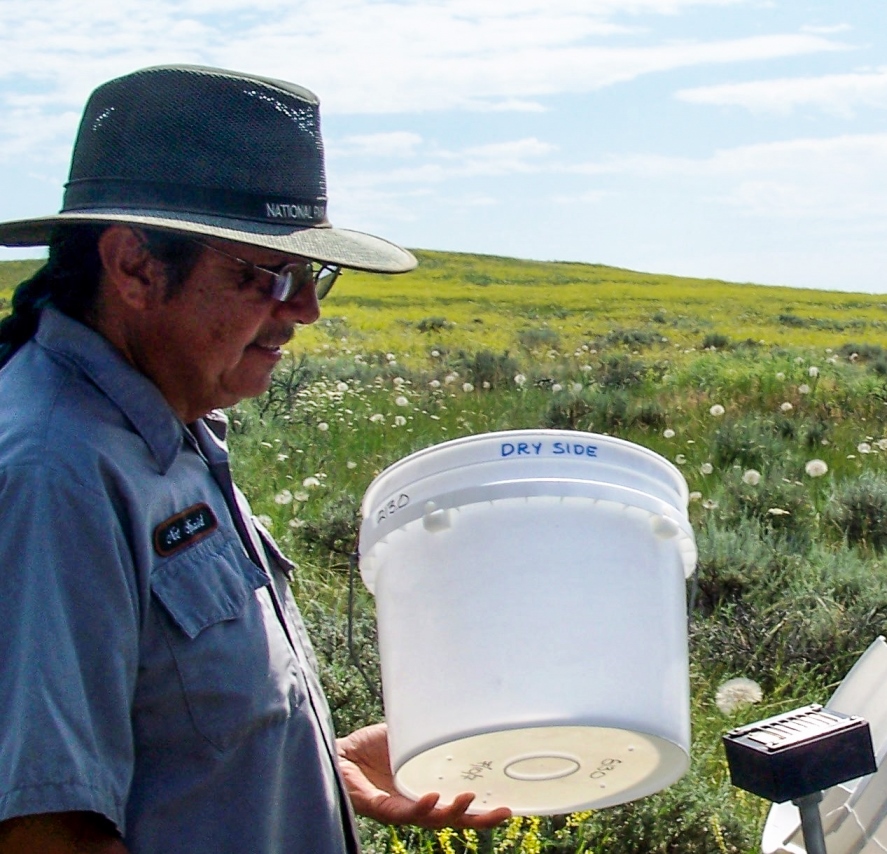
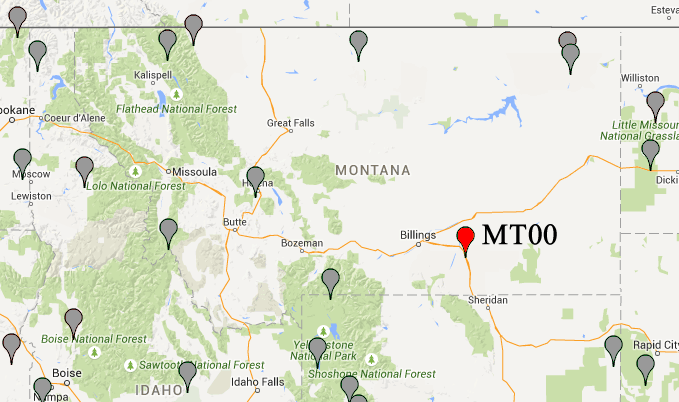
In late March 2015, the 400,000th National Trends Network (NTN) sample was taken at site MT00, located at the Little Bighorn Battlefield National Monument in Montana (see Figure 4). MT00 has been in operation since 1984, and the current site operator is Wayne Not Afraid (pictured at left), a park ranger with the National Park Service. Wayne has served as the site operator since 1997. As part of the NTN, this site measures the major ions and acidity of precipitation.
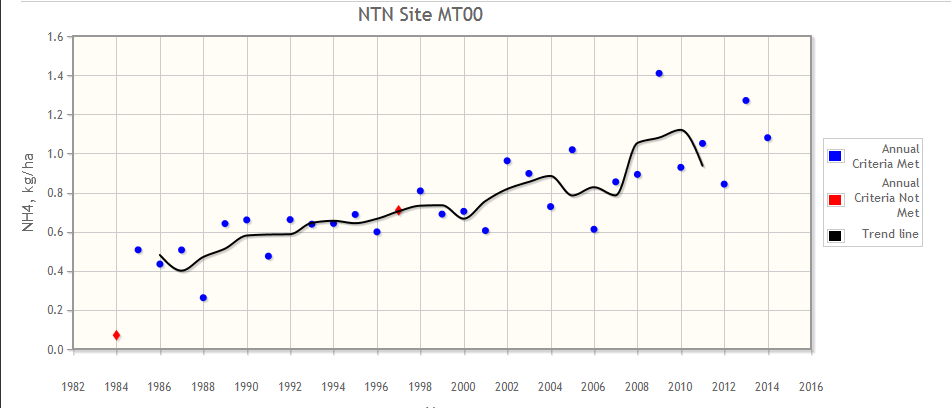
The 400,000th sample was collected at MT00 on March 24th, and logged in at NADP’s Central Analytical Laboratory (CAL) as sample TO0040SW. The sample chemistry was notable for its elevated ammonium ion concentration. Ammonium ion deposition has shown a steadily increasing trend at MT00 (see Figure 5). More information about the station is available.
|
|
|
Figure 4. Click to enlarge
|
The MT00 site represents a large region in the North-Central United States where significant increases in ammonium and nitrogen deposition have been noted. An animated movie of these changes can be viewed online.
The NTN started sampling in 1978 and is the only network providing long-term record of precipitation chemistry across the United States. It is the largest network globally doing such measurements. Sites are predominately located away from urban areas and point sources of pollution. Each site is equipped with an automated precipitation collector and a recording raingage. More information about the NTN is available at http://nadp.isws.illinois.edu/ntn/.
|
|
|
Figure 5. Click to enlarge
|
The first NTN sample was collected on July 11, 1978 in Parsons, West Virginia (WV18). The 100,000th NTN sample was collected in August 1991, also coincidentally at MT00! Other notable NTN samples included the 200,000th sample in May 2000 from Mt. Rainier National Park (WA99) and the 300,000th sample in October 2007 from the Northern Agricultural Research Center in Havre, Montana (MT98). CAL director Chris Lehmann said that with 265 active sites, it’s expected that the 500,000th sample should be received at CAL sometime in mid- 2022.
The NADP thanks all of its site operators and supervisors for their efforts to collect samples and maintain the equipment at their sites. Their contributions ensure the continued success of NADP!
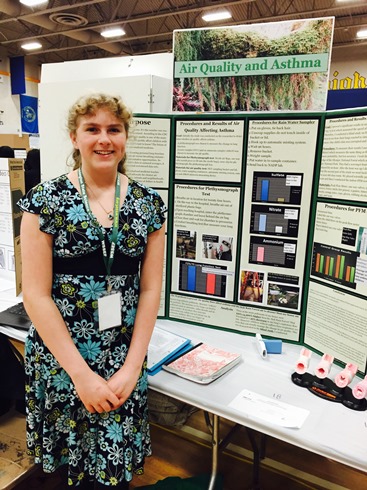
Washington State 8th Grader Wins First Place for NADP-Related Science Fair Project
|
|
|
Figure 6. Click to enlarge
|
Ella Ashford, an 8th grade student from Port Townsend, Washington, won first place at the 2015 Washington State Science and Engineering Fair for her 4-H project, Air Quality and Asthma. According to the Center for Disease Control, air quality is one of the main causes of asthma among 6.8 million kids in the United States, including Ella. Finding out exactly how much air quality affects children with asthma was the main motivation for Ella’s project. She had noticed that when she went to the mountains her symptoms seemed to go away, and she always wondered what was different about the air in the mountains that made her feel better.
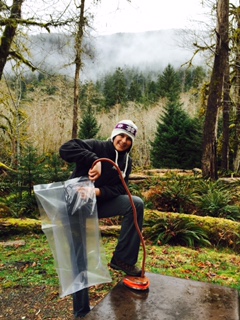
For the project, Ella’s hypotheses were that i) the air breathed from the Hoh Rainforest, located in Olympic National Park in Washington, will show better lung function results than the air breathed in a house and ii) the air quality tests measuring Hoh Rainforest air will result in cleaner air samples than that of a house. The NADP has monitored pollutants in rainwater at Olympic National Park (site WA14) since 1980 as part of the National Trends Network (NTN). Ella worked with NADP site operator Jon Preston, who has collected NADP samples at WA14 since 2007.
|
|
|
Figure 7. (Click to enlarge)
|
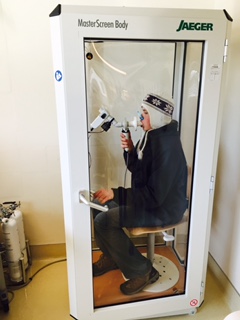
In order to test her hypotheses, Ella compared her lung function after breathing air at two locations, the Hoh Rainforest and her own living room. To measure her lung function, she used a device called a plethysmograph, which measures the total chest wall movement as well as pulmonary function using spirometry. The procedures for the plethysmograph test included breathing air in a location for 24 hours, breathing air out of sterilized plastic bags on the way to the hospital, entering the plethysmograph chamber, closing the door of the chamber and waiting for it to pressurize, and conducting the breathing test that measured her lung function. The NADP’s Central Analytical Laboratory (CAL) provided advice to Ella in how to collect air at the Hoh Rainforest and modified clean-room class bags normally used to package NADP sampling supplies.
|
|
Figure 8. (Click to enlarge) |
|
|
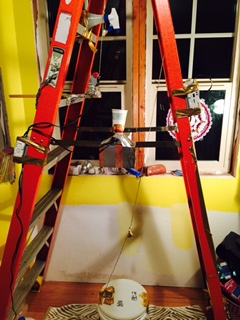
In addition to the plethysmograph test, Ella also measured the air quality in the Hoh Rainforest versus her living room by using a water sampler and an ammonia sampler. Data for the Hoh Rainforest was collected by NADP, but to test the air quality in her living room, Ella developed an automatic misting system (Figure
9) and utilized a custom-made sampler to collect the resulting “indoor rain” water. The CAL provided Ella with ammonia air samplers and also analyzed the water she exposed in her home.
In the end, Ella’s hypotheses were proven correct: air quality does affect asthma and the Hoh Rainforest air is cleaner than her home air. Three of the main pollutants (sulfate, nitrate, and ammonium) in her house were 150% to 13,900% higher than NADP data from the Hoh Rainforest! That resulted in a 20% decrease in her lung’s expiratory flow rate. Children without asthma have respiratory systems that can usually manage the change in air quality, which was demonstrated by a blind study she conducted.
|
|
|
Figure 9. (Click to enlarge)
|
This study is important because it shows the direct connection between asthmatic conditions in children and poor air quality. Ella is now a peer mentor for asthmatic children in Jefferson County Washington and she plans to teach kids how to self-advocate for clean air in their lives.
Congratulations to Ella and her impressive, successful project!
New NADP Sites Established at State Agricultural Experiment Stations
|
|
|
Figure 10. (Click to enlarge)
|
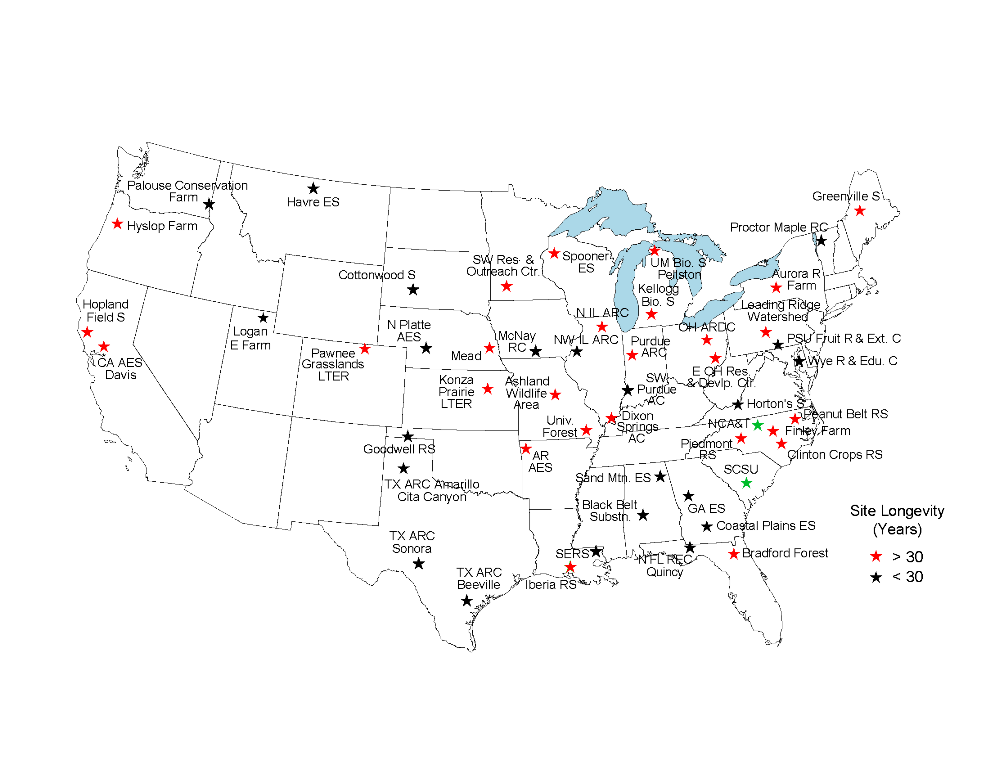
The NADP was established in 1977 under the State Agricultural Experiment Station (SAES) leadership. Over the last several months, work has been ongoing to establish two new NADP sites at SAES sites associated with Historically Black Colleges and Universities. These new SAES sites, along with 43 others, form the core of the National Trends Network and the National Research Support Project (NADP’s core project). The new sites are being established through a Department of Energy Office of Environmental Management research cooperative and local universities grant.
The new sites are shown using green stars in the accompanying figure, and are:
-
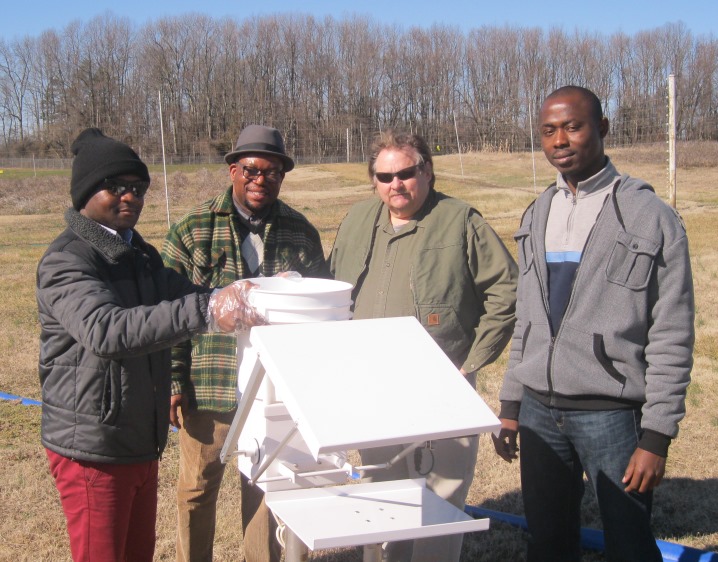
North Carolina Agricultural and Technical State University (NC17) (Figure 10), established in 1891, Greensboro, North Carolina (this site is currently operating and data from February will be available soon);
- South Carolina State University, established in 1896, Orangeburg, South Carolina (currently selecting location on campus using NADP siting criteria and anticipate operation in summer 2015)
The new sites will operate both a National Trends Network site and a collocated Mercury Deposition Network site. We are happy to have this new site, and watch for their data coming in the next several months.
Acid Rain 2015: Call for Abstracts is open!
On October 19-23, 2015 in Rochester, NY, the International Acid Rain Conference will return to the United States for the first time since 1975. This 9th Acid Rain Conference will highlight the latest information and research on acid rain – environmental effects, the status of recovery across affected regions, and new policies that will define the future. The theme of Acid Rain 2015 is Successes Achieved and Challenges Ahead.
The Call for Abstracts is open for Acid Rain 2015! There will be 105 slots for oral presentations, and 180 slots for poster presentations. The submission deadline is June 30, 2015.
The Acid Rain 2015 organizers have received tentative approval from the Editorial Board of the Elsevier journal, Atmospheric Environment, to produce a special journal issue of select papers from the conference. The organizers anticipate that the papers that will be a part of this special issue will consider a full range of topics within the scope of Atmospheric Environment, including emissions, atmospheric transport, deposition, environmental effects of sulfur and nitrogen air pollutants, and the success of policies that have attempted to address acid rain. If you are interested in contributing a paper to this special issue, please check the box “Would like to contribute paper to Atmospheric Environment" when you submit your abstract.
Recent Publications
A listing of recent journal publications that have used NADP data. Publications are separated by network.
National Trends Network (NTN)
Clay, N. A., Donoso, D. A., & Kaspari, M. (2014). Urine as an important source of sodium increases decomposition in an inland but not coastal tropical forest. Oecologia 177: 571–579.
doi:10.1007/s00442-014-3183-4
Kinsman‐Costello, L. E., O'Brien, J. M., & Hamilton, S. K. (2015). Natural stressors in uncontaminated sediments of shallow freshwaters: The prevalence of sulfide, ammonia, and reduced iron. Environmental Toxicology and Chemistry 34: 467–479.
doi:10.1002/etc.2801
Lopez-Rodriguez, G., Sotomayor-Ramirez, D., Amador, J.A., & Schroder, E.C., 2015. Contribution of nitrogen from litter and soil mineralization to shade and sun coffee (Coffea arabica L.) agroecosystems.
Tropical Ecology 56(2): 155-167.
Qiao, X., Xiao, W., Jaffe, D., Kota, S. H., Ying, Q., & Tang, Y. (2015). Atmospheric wet deposition of sulfur and nitrogen in Jiuzhaigou National Nature Reserve, Sichuan Province, China. Science of The Total Environment 511: 28-36.
doi:10.1016/j.scitotenv.2014.12.028
Robertson, W. M., & Sharp, J. M. (2015). Estimates of net infiltration in arid basins and potential impacts on recharge and solute flux due to land use and vegetation change. Journal of Hydrology 522: 211-227.
doi:10.1016/j.jhydrol.2014.11.081
Sickles, I. I., & Shadwick, D. S. (2015). Air quality and atmospheric deposition in the eastern US: 20 years of change. Atmospheric Chemistry and Physics 15(1): 173-197.
doi:10.5194/acpd-14-17943-2014
Templer, P. H., Weathers, K. C., Lindsey, A., Lenoir, K., & Scott, L. (2015). Atmospheric inputs and nitrogen saturation status in and adjacent to Class I wilderness areas of the northeastern US. Oecologia 177(1): 5-15.
doi:10.1007/s00442-014-3121-5
Wang, Y., Y. Xie, L. Chai, W. Dong, Q. Zhang, and L. Zhang, 2014: Impact of the 2011 southern US drought on ground-level fine aerosol concentration in summertime. J. Atmos. Sci., in press.
doi:10.1175/JAS-D-14-0197.1
Yahya, K., Wang, K., Zhang, Y., & Kleindienst, T. E. (2015). Application of WRF/Chem version 3.4. 1 over North America under the AQMEII Phase 2: evaluation of 2010 application and responses of air quality and meteorology–chemistry interactions to changes in emissions and meteorology from 2006 to 2010. Geoscientific Model Development Discussions 8(2): 1639-1686.
doi:10.5194/gmdd-8-1639-2015
Zhou, Q., Driscoll, C. T., & Sullivan, T. J. (2015). Responses of 20 lake-watersheds in the Adirondack region of New York to historical and potential future acidic deposition. Science of The Total Environment 511: 186-194.
doi:10.1016/j.scitotenv.2014.12.044
Mercury Deposition Network (MDN)
Dastoor, A., Ryzhkov, A., Durnford, D., Lehnherr, I., Steffen, A., & Morrison, H. (2015). Atmospheric mercury in the Canadian Arctic part II: Insight from modeling. Science of The Total Environment 509–510: 16–27.
doi:10.1016/j.scitotenv.2014.10.11
Gann, G. L., Powell, C. H., Chumchal, M. M., & Drenner, R. W. (2015). Hg‐contaminated terrestrial spiders pose a potential risk to songbirds at Caddo Lake (Texas/Louisiana, USA). Environmental Toxicology and Chemistry 34 (2) 303–306.
doi:10.1002/etc.2796
Atmospheric Mercury Network (AMNet)
Wright, L. P., & Zhang, L. (2015). An approach estimating bidirectional air‐surface exchange for gaseous elemental mercury at AMNet sites. Journal of Advances in Modeling Earth Systems.
doi:10.1002/2014MS000367
Ammonia Monitoring Network (AMON)
Butler, T., R. Marino, D. Schwede, R Howarth, J. Sparks, K. Sparks, 2015. Atmospheric ammonia measurements at low concentration sites in the northeastern USA: implications for total nitrogen deposition and comparison with CMAQ estimates. Biogeochemistry 122:191–210.
doi:10.1007/s10533-014-0036-5
Puchalski, M. A., Rogers, C. M., Baumgardner, R., Mishoe, K. P., Price, G., Smith, M. J., Watkins, N., & Lehmann, C. M. (2015). A statistical comparison of active and passive ammonia measurements collected at Clean Air Status and Trends Network (CASTNET) sites. Environmental Science: Processes & Impacts 17: 358.
doi:10.1039/c4em00531g
| 

